Wind energy
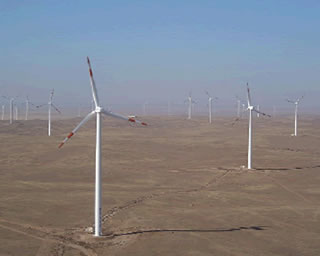
Turbine wakes captured using arc scanning pattern
A single LiDAR can scan over a large area, enabling coverage of many wind turbines. The velocity field data below-right is a plan view of multiple turbines and shows the wake trail coming from them.
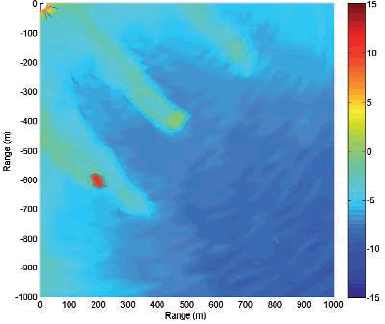
One arc scan across an active wind farm. The red area is a blade strike from a turbine, and shows how the wake from another turbine upwind, is feeding directly into it.
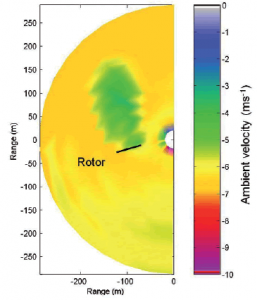
A 30 minute average of many arc scans. This shows a single turbine wake and the effect that the turbine has on the ambient wind flow.
Note: The background wind speed values have been corrected to remove the effect of the LiDAR observation angle.
Wind speed and direction measurements
A fundamental characteristic of all Doppler LiDARs, is the ability to measure the line of sight Doppler component along the out-going beam.
Normally, a series of individual beams or rays must be acquired in order to sample the wind field at sufficiently different angles to allow the wind speed and direction to be calculated. An anemometer will sample the wind over a very small volume – like a metre cubed for example, whereas the LiDAR will generally give an averaged result taken over a much larger area (hundreds of metres).
These different measurement techniques can often produce a difference between wind data as measured with a point sensor like an anemometer, and a volume sampling device like a LiDAR or a Radar wind profiler. To some extent, the results will be very similar as long as the wind is behaving in a uniform manor, so that the LiDAR and point sensor both experience the same conditions.
The LiDARs are often used in a PPI scanning arrangement for wind data measurement – which essentially involves scanning the beam through a full 360° at a selection of evenly separated azimuth angles at a fixed elevation. The data set can then be processed to give a wind speed and direction for each discreet range gate.
The result is a wind profile that applies directly over the device, and represents an average over the conical shape that has been sampled (increasing volume with height). Another method is to scan a sector at a fixed and usually, low elevation.
Typically, a sector of at least 90° in azimuth (sampled with 10° increments for example) should be used in order to provide a sufficient data for sector scanning analysis. The data below was captured using this technique.
A further technique which will result in a much smaller volume measurement – and more comparable to a point sensor, is the dual or triple Doppler measurement. In this case, more than one LiDAR is used to sample the same small area of atmosphere at the same as another one or two LiDARs . The LiDARs must all be sufficiently separated in distance in order to provide a sufficient amount of observation angle difference. In this way, each LiDAR will measure a different component to the others, and knowing the positions of the LiDARS will allow the wind data to be calculated at each point where the beams intersect.
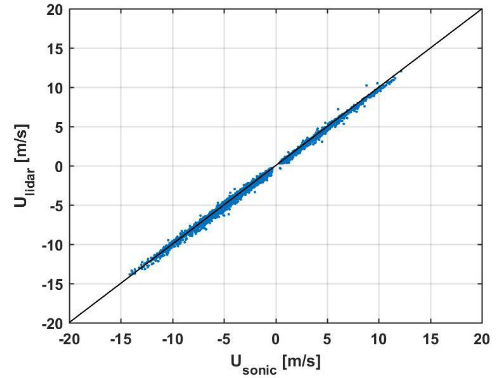
Correlation plot of a StreamLine XR LiDAR and a sonic anemometer – taken in complex terrain. The full document is available here.
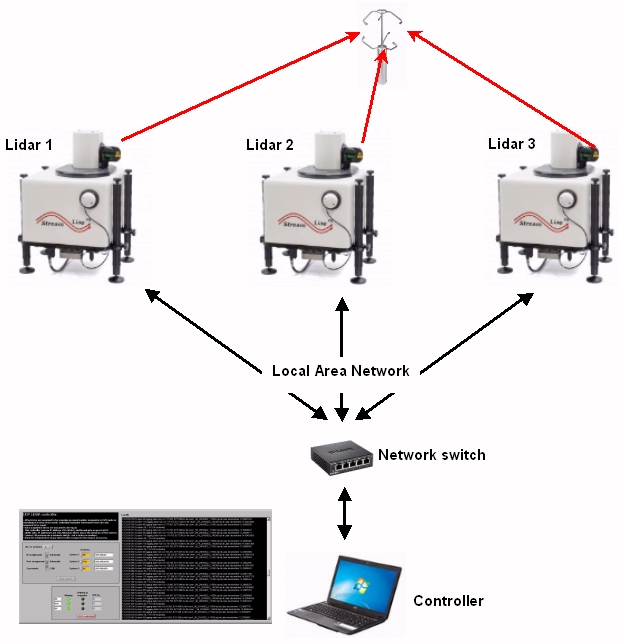
Dual and triple Doppler measurements
The all-sky scanning StreamLine and StreamLine XR models all ship with free software, that will allow the individual units to synchronise both in scanner movement and data acquisition. Each LiDAR can sample the same volume of air at the same time as others, thus defining a series of virtual masts in space.
Due to the long range of the LiDARs , a large area can be sampled which negates the need for deploying in several positions at each site in order to sample the wind in different locations. This is especially useful for off shore where redeployments would be difficult.